Most wildfire exposure assessments used in underwriting, due diligence and disclosure are built on one thing: what has already burned. A historical baseline tells you where fires have happened. It does not tell you where they are becoming more likely.
That distinction matters more than it used to. Wildfires and climate change are shifting the ground beneath asset-level risk models faster than historical maps can be redrawn, and Spain's 2026 fire season gives a concrete, model-tested example of what that gap looks like in practice. This article walks through what happened, why the historical record understates the risk going forward, and what a forward-looking wildfire risk assessment needs to include.
What Spain's 2026 fire season revealed
In July 2026, a wildfire in Ávila province burned approximately 40,000 hectares, becoming one of the largest individual blazes in Spain's recorded history. A separate fire in the Madrid region burned nearly 20,000 hectares. Combined, these blazes triggered evacuations across Madrid, Toledo, and Ávila, affecting more than 60,000 people.
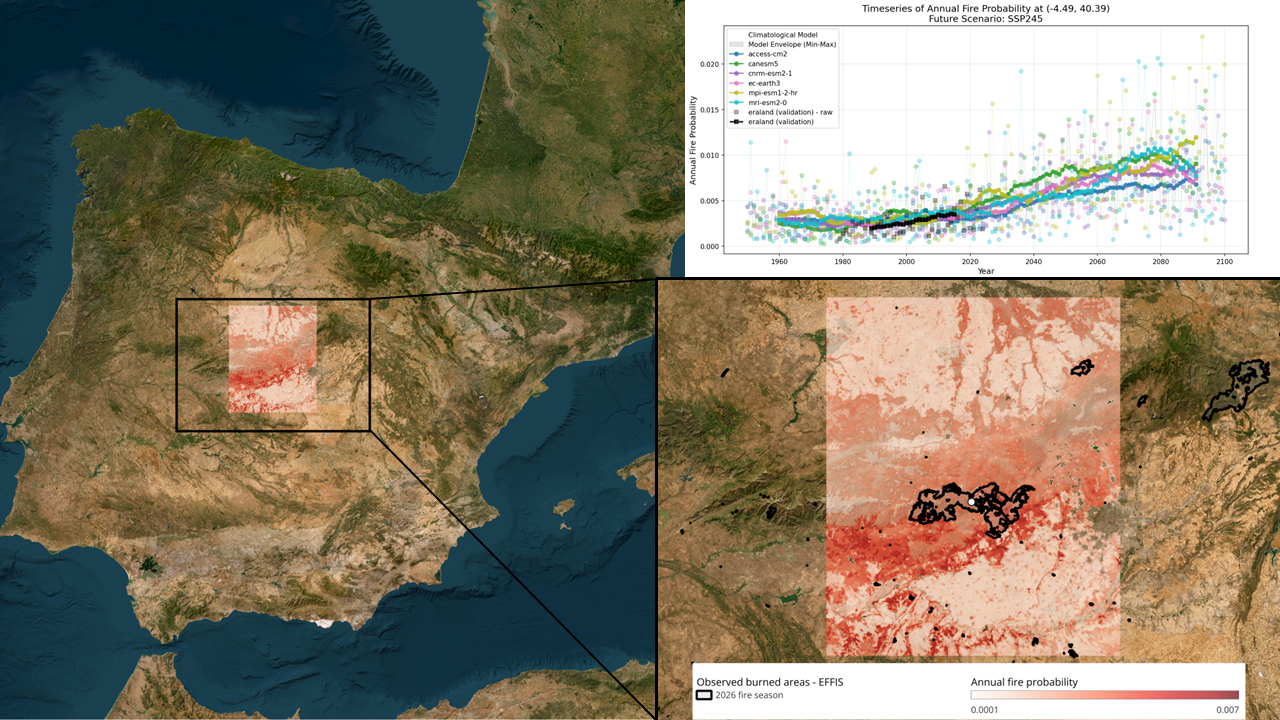
The scale is well documented. The more useful detail, for anyone responsible for asset risk, sits underneath it. Mitiga's model output for the affected area shows that the burned zone had been transitioning from moderate to relatively high average annual fire probability across the 1990–2024 historical period. It was not a location a historical hazard map would have flagged as extreme.
That is the gap this article is about. Not the size of the fire, but the fact that the ground it burned was still classified, on paper, as manageable.
Why historical fire probability tells only half the story
A historical average describes a climate that no longer exists. That is the core limitation of any hazard map built purely on past events, and it applies as much to wildfire as to flood or wind risk.
At the location inside the 2026 burn scar, annual fire probability has been rising over time, driven by increasingly severe fire weather conditions. The trajectory is not flat.

In practical terms: a fire event historically classified as a one-in-fifty-year occurrence is not a one-in-fifty-year occurrence any more. Climate change and wildfire risk are moving together, and a static baseline built on 1990–2024 data will keep understating risk as conditions continue to shift under any credible future scenario.
This is the part of wildfire and climate change analysis that a single map cannot capture. It needs a time series.
What fire weather actually measures
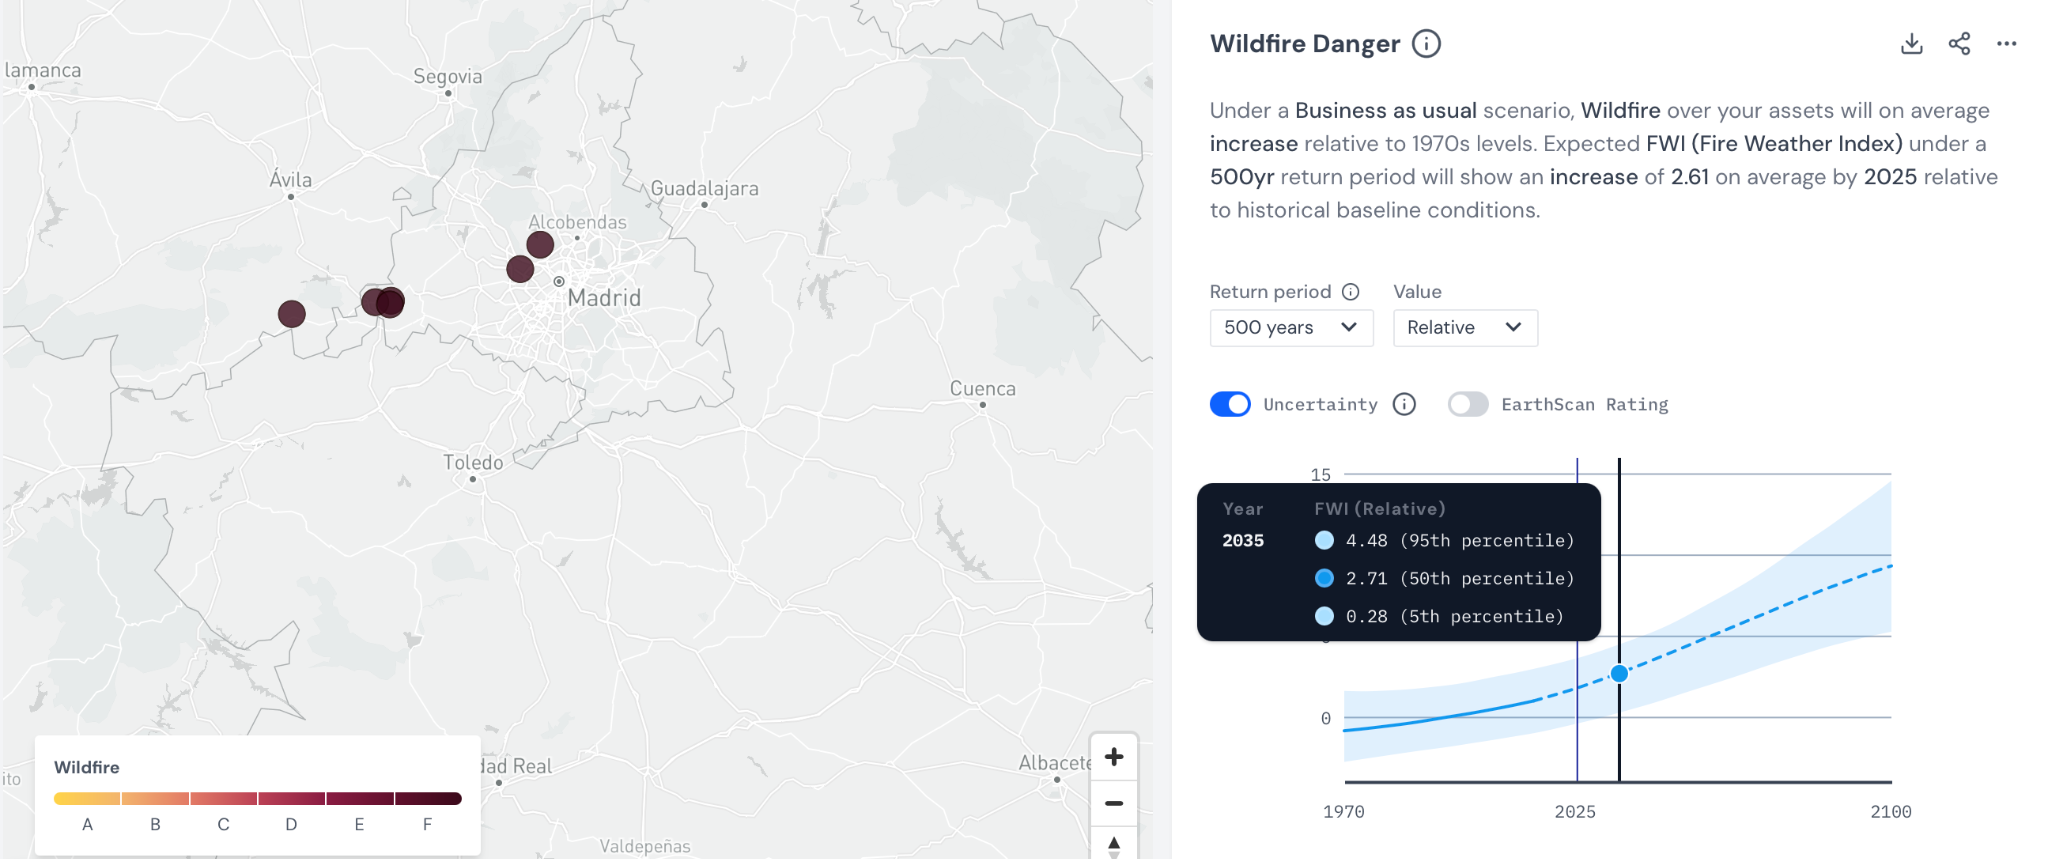
Fire weather indices capture the atmospheric conditions that make ignition and spread more likely: temperature, humidity, wind speed and drought stress. They are a useful, well-established input, and they move in the direction you would expect as conditions get hotter and drier.
But an index built purely on atmospheric conditions is not the same thing as fire risk. Whether a fire starts, and how far it travels once it does, depends on vegetation and fuels, terrain, and human activity on the ground. Two locations with an identical fire weather reading can carry very different levels of actual fire risk, depending on what sits between the ignition point and the nearest asset.
That is why fire weather belongs in a risk assessment as one input among several, not as the risk assessment itself.
What forward-looking wildfire risk assessment requires
A wildfire risk assessment built to withstand scrutiny from a regulator, an investment committee or an insurer needs to meet a specific set of criteria, regardless of which provider produces it:
- Resolution fine enough to distinguish between individual assets, not regional averages
- Inputs that combine atmospheric conditions, vegetation characteristics and anthropogenic influence
- Projections forward under multiple climate scenarios and time horizons, rather than extrapolation from past events
- Return periods and explicit uncertainty ranges, so the output can be defended and audited
- Traceability back to peer-reviewed science and recognised datasets
EarthScan, Mitiga's climate risk intelligence platform, combines CMIP6 climate model inputs at the asset level to project wildfire hazard through 2100, providing outputs in five-year increments together with associated return periods and percentile ranges. Building on these capabilities, Mitiga is developing next-generation wildfire models that further enhance the spatial detail of hazard assessments by incorporating vegetation characteristics and human-driven factors. These advances make it possible to evaluate wildfire hazard at the scale at which events actually occur, enabling comparisons such as the Ávila case study presented above.
What this changes for risk decisions
The gap between historical and forward-looking wildfire data plays out differently depending on where you sit in the decision chain.
- Underwriting and pricing Renewal pricing anchored to loss history misprices exposure wherever fire probability is rising rather than flat. This sits behind the widening protection gap already visible across parts of southern Europe.
- Asset acquisition and due diligence An asset in an area historically rated moderate may carry materially higher forward risk than the label suggests, with direct consequences for valuation and hold-period assumptions.
- Siting infrastructure and renewable assets Solar, wind and transmission assets are typically built for operating lives of thirty years or more. A siting decision made against a historical hazard map locks in exposure for the full life of the asset, based on conditions that will have moved on.
- Physical risk disclosure Both CSRD/ESRS E1 and IFRS S2 require forward-looking physical risk assessment under defined scenarios. A historical hazard map, on its own, does not meet either requirement.
The historical record is now a floor, not a forecast
Spain's 2026 fire season did not burn through ground that models had missed. It burned through ground that was already showing a rising trend, in an area a historical map would have called moderate. That is the pattern forward-looking wildfire risk assessment is built to catch, and it is the pattern a backward-looking one, by definition, cannot.
For anyone pricing, acquiring, siting or reporting on physical assets, the question is no longer whether historical data is useful. It is whether it is being used as a starting point or as the whole answer.
See how forward-looking wildfire risk is modelled at asset level

.png)