Most people have seen a sea level rise map: a familiar coastline, a slider set to 2050 or 2100, and a band of blue spreading over ports, waterfronts and low-lying neighbourhoods. It is a useful picture. It is also an incomplete one.
For anyone who owns, lends against or insures coastal property, the question is more specific. Coastal assets are priced, insured and financed today against a hazard that changes over their holding period. A map that shows where water could reach under one scenario says little about how often a site will flood, how soon, or what each event will cost.
This article explains how to read a sea level rise map, compares the main public tools across the European Union, the United States, Canada and Australia, and sets out what those tools leave out. It then looks at where coastal exposure concentrates and what it means for asset values.
What a sea level rise map actually shows
Most sea level rise maps show one of two things. Some show permanent inundation: land that would sit below a projected mean sea level or high tide line. Others show flood extents for a chosen water level, which may add tides or storm surge on top of the rise. Our glossary covers the basics of sea level rise and coastal flooding.
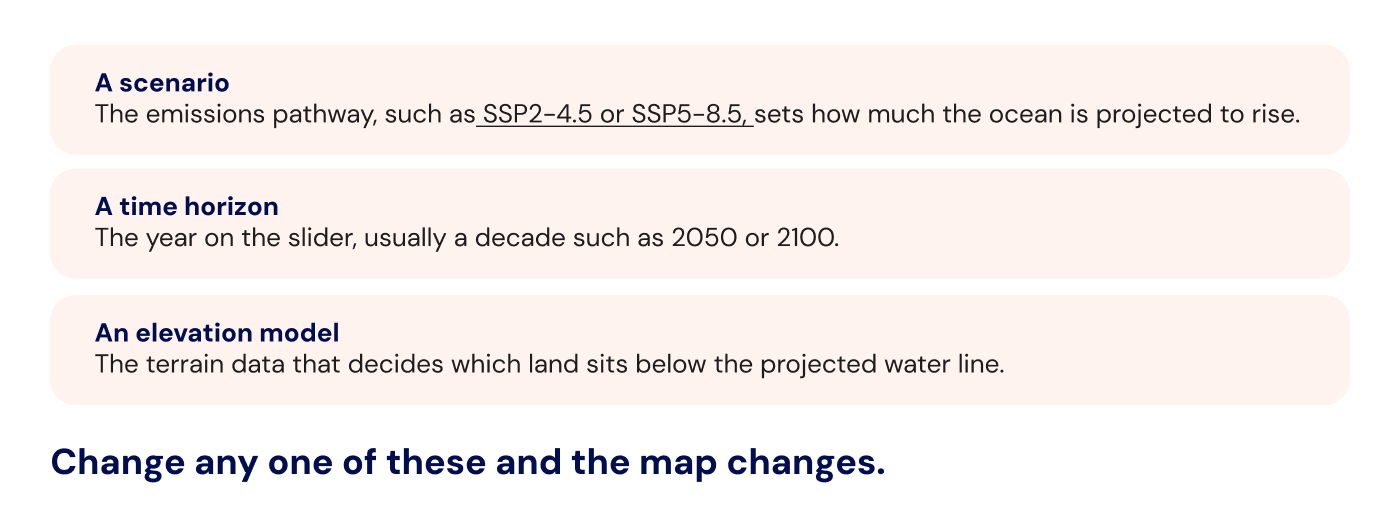
Every map depends on three inputs:
Maps also differ in whether they show global or local sea level. Local, or relative, sea level combines the global rise with vertical land motion. Where land is sinking, local rise runs ahead of the global average. Where land is rising, it can fall behind it. Canadian government guidance gives a clear example: relative sea level is projected to rise faster than the global average in parts of Atlantic Canada, where land is subsiding, and to fall around Hudson Bay, where land is still rebounding after the last ice age [1].
For most coastal assets, the near-term question is less about permanent inundation and more about frequency. A higher baseline means storm surge and high tides reach further, more often. The IPCC projects that local sea levels which historically occurred once a century will become at least annual events at most coastal locations during the 21st century [2].
Coastal flooding is one of several flood types, each with its own drivers; our guide to types of flooding explains how they differ.
Interactive sea level maps: the main public tools
Several public agencies and research organisations publish interactive sea level maps. They are free, built on peer-reviewed science, and good at what they were designed for: awareness, screening and public planning. Here are the main ones across our four regions.
United States
NOAA Sea Level Rise Viewer. Published by NOAA's Office for Coastal Management, it shows community-level impacts of sea level rise or coastal flooding up to 10 feet above average high tides, along the contiguous US coast excluding the Great Lakes [3]. Tabs cover local scenarios, mapping confidence, marsh migration and high tide flooding.
NASA Sea Level Projection Tool. Built by NASA's Sea Level Change Team, it gives global and regional projections from the IPCC Sixth Assessment Report (AR6) for 2020 to 2150 under several scenarios [4]. It reports projected sea level at points on the ocean and coastline, not flood extents over land.
Global
Climate Central Coastal Risk Screening Tool. A global map of projected sea level rise and coastal flood risk by year, water level and elevation dataset, under multiple emissions scenarios [5]. Climate Central itself describes its maps as screening tools for identifying places that may need deeper investigation [5]. Its newer Coastal Risk Finder focuses on people, homes and land at risk in the US [6].
European Union
European Climate Data Explorer (Climate-ADAPT). Run by the European Environment Agency with data from the Copernicus Climate Change Service, it includes a relative sea level rise index and an extreme sea level index [7]. The sea level series runs to 2050 under a single high-emissions scenario, SSP5-8.5, and is designed mainly for policymakers [7].
Canada
ClimateData.ca relative sea-level change. Natural Resources Canada's dataset gives CMIP6-based projections for every decade from 2020 to 2150, for four emissions scenarios plus two low-probability, high-impact cases, at roughly 0.1° resolution [1]. The CanCoast database adds a coastal sensitivity index for Canada's marine coasts.
Australia
CoastAdapt Sea-Level Rise and You. Provides sea level rise scenarios, graphs, tables and inundation maps for every coastal council in Australia [8]. The inundation maps combine average projected sea level rise for a scenario with the highest tide [9].
Where sea level rise maps fall short for asset decisions
Public sea level maps answer a public question: which places should a community, region or country look at first? An investor, lender or asset manager asks something narrower. What will this specific building, portfolio or loan book face over the years we hold it, and what will that cost? The gaps below reflect that difference in purpose, not a flaw in the tools.
Water is raised, not moved. Many maps use a passive or "bathtub" approach: they raise the water level and flood every cell below it that connects to the sea. NOAA-funded datasets in the Pacific, for example, state plainly that their high tide flooding layers use this method and do not represent flooding under high-wave conditions [10]. How surge and waves travel inland, and how sea walls or drainage perform, sits outside the model.
One scenario, one year per view. A map shows a single combination of scenario and horizon. An asset needs a trajectory across its holding period, and more than one scenario to test how sensitive its value is to the outcome. Some datasets offer only one pathway: the European Climate Data Explorer's sea level index covers SSP5-8.5 alone [7].
Resolution and elevation quality vary. Elevation data is the foundation of any flood map, and its quality is uneven. Climate Central, for instance, uses different elevation data inside and outside the United States [5]. Canada's national projections are gridded at roughly 0.1°, about 11 km north to south [1]. That is suitable for regional planning but coarse for a single site.
Extent, not frequency, damage or money. A map shows where water could reach. It does not show how often a site floods, how deep the water gets on a typical event, or what the damage costs. Some products separate the components entirely: the European extreme sea level index gives a 100-year water level from tides and surge but excludes sea level rise [11].
Methods differ by country. Each national tool uses its own scenarios, baselines and elevation data. Australia's council-level projections were built on the older RCP scenarios [12], while the newer US and Canadian tools use AR6-era scenarios [1][4]. A portfolio spanning the EU, North America and Australia cannot be compared like for like by stitching these maps together.
Where coastal exposure concentrates
Coastal exposure is not spread evenly along a coastline. It concentrates in a small number of settings:
- low-lying urban waterfronts
- estuaries and deltas
- land that is subsiding
- reclaimed land
- ports and the energy and logistics infrastructure around them
The evidence points the same way at every scale. A global OECD screening study of large port cities found that the ten cities with the highest population exposure to coastal flooding hold roughly half of the total, and the top 30 about 80% [13]. Within Europe, research on seaports found that under a high warming scenario, increases in extreme sea level above 1 metre are projected for the North Sea, the western Baltic and parts of the British and French Atlantic coasts. Mediterranean and Black Sea ports face lower extreme levels, but more frequent events [14]. In the United States, the 2022 federal interagency report projects about 0.3 metres (one foot) of average rise along US coastlines by 2050, with larger increases on the East and Gulf coasts and roughly half that on the West Coast [15].
Regional averages still hide the decisive detail. Two neighbouring assets can sit on opposite sides of a threshold: a few centimetres of ground elevation, the line of a sea wall, or the capacity of a drainage outfall. One may face occasional nuisance flooding over its holding period. The other may move into a regular flood return period well before its loan matures. A coastline-wide map coloured in a single shade of blue will rarely show that difference.
What sea level rise means for asset values
Sea level rise reaches asset values through four channels: price, insurance, financing and disclosure.
Valuation and pricing
Markets already price part of this exposure. A peer-reviewed study of US coastal homes found that properties exposed to projected sea level rise sell for about 7% less than comparable unexposed homes the same distance from the beach, and that the discount has grown over time [16]. Homes not projected to flood for almost a century still showed a 4% discount, while rents showed none, which points to buyers pricing expected future damage [16]. The study covers residential sales, but the mechanism applies to any asset valued on future cash flows. See how this plays out for property portfolios on our real estate page.

Insurability and insurance cost
The EU's insurance supervisor, EIOPA, expects shrinking availability and rising cost of insurance as losses increase [17]. For a coastal asset, higher premiums or narrower cover reduce net operating income, and the expectation of further increases weighs on exit value.
Financing and hold-period risk
A 25- or 30-year loan outlasts the 2050 view most people check on a map, and the asset will often change hands within that window. European banking supervisors expect lenders to consider climate-related risks at every stage of the credit-granting process, over the short, medium and long term [18]. The relevant question becomes how exposure changes across the full tenor of a loan.
Disclosure
IFRS S2 requires companies to use climate-related scenario analysis to assess the resilience of their strategy, and to state over which time horizons each risk could affect them [19]. In the EU, the revised ESRS adopted by the European Commission in July 2026 keep a dedicated disclosure on climate-related risks and scenario analysis within ESRS E1 [20][21]. A single map view, with one scenario and one year, does not meet either bar.
What asset-level coastal risk assessment requires
To use coastal risk in valuation, lending or disclosure, an assessment needs five things:
- Asset-level resolution. Results for the specific location of each building or site, not coastline-wide averages.
- Combined hazards. Sea level rise assessed together with storm surge and tidal flooding, not permanent inundation alone.
- Scenarios across time. More than one emissions scenario, with time horizons that match the holding period or loan tenor.
- Frequency, uncertainty and money. Return periods with uncertainty ranges, translated into financial terms such as expected damage and climate value at risk.
- One methodology. The same approach in every country in the portfolio, so results can be compared and aggregated.
This is the gap EarthScan, Mitiga Solutions' climate risk intelligence platform, is built to close. It combines CMIP6 global climate models and CORDEX regional models with more than 40 years of observations from over 100,000 stations in 180 countries. It returns asset-level results for coastal flooding and other physical hazards, under multiple scenarios, with continuous projections in five-year increments from 1970 to 2100. Our Multiple Futures Model quantifies uncertainty and provides return periods from 2 up to 1,000 years, using one consistent methodology wherever your assets are.
From sea level rise map to asset value

The public tools from NOAA, NASA, Climate Central, the EEA, Natural Resources Canada and CoastAdapt are good starting points for screening. Valuing, insuring, financing or disclosing coastal exposure asks for more: results for the specific asset, surge and tides on top of a rising baseline, several scenarios across the holding period, and figures expressed in money. The difference between two neighbouring buildings often decides the investment case, and that difference rarely shows on a map.
Sources
- ClimateData.ca / Natural Resources Canada. Guidance on using relative sea-level change datasets.
- IPCC (2019). Special Report on the Ocean and Cryosphere in a Changing Climate, Figure TS.6: effect of regional sea level rise on extreme sea level events.
- NOAA / Climate.gov. Sea Level Rise map viewer.
- NASA Sea Level Change Team. Sea Level Projection Tool.
- Climate Central, via CAKE. Coastal Risk Screening Tool.
- Climate Central (2025). New U.S. coastal risk map and analysis: Coastal Risk Finder.
- Climate-ADAPT / Copernicus Climate Change Service. Relative sea level rise index.
- CoastAdapt. Sea-Level Rise and You: information about future risks.
- The Conversation, via PreventionWeb. Australia: coastal councils are already adapting to rising seas.
- PacIOOS / NOAA, via Data.gov. Sea Level Rise: American Samoa: High-Tide Flooding, 5-ft scenario (method description).
- Climate-ADAPT / Copernicus Climate Change Service. Extreme sea level index.
- Queensland Climate Resilient Councils library. Sea-level rise and future climate information for coastal councils (CoastAdapt, 2017).
- OECD, via Climate-ADAPT. Ranking of the world's cities to coastal flooding.
- Climate-ADAPT. Sea-level rise in ports: a wider focus on impacts.
- NPR (2022). Ocean water along U.S. coasts will rise about one foot by 2050, scientists warn (reporting on the 2022 interagency Sea Level Rise Technical Report).
- Bernstein, A., Gustafson, M.T. and Lewis, R. (2019). Disaster on the horizon: the price effect of sea level rise. Journal of Financial Economics, 134(2), 253–272.
- EIOPA (2024). Leveraging insurance to shore up Europe's climate resilience.
- ECB Banking Supervision, via PreventionWeb. Guide on climate-related and environmental risks.
- IFRS Foundation. IFRS S2 Climate-related Disclosures.
- WPK (2026). European Commission adopts delegated acts on the simplified ESRS and the voluntary standard.
- EFRAG (2026). ESRS E1 to E5 overview, simplified ESRS.