The insurance industry exists to absorb risk that others cannot carry alone. That promise is now under pressure. As extreme weather grows more frequent and more severe, entire regions and asset classes are drifting towards uninsurability, not because the risk cannot be managed, but because it is difficult to price with confidence using tools built for a different climate.
This is the identity crisis facing insurers today: the moment people and businesses need protection most is the same moment that protection is becoming harder to offer. The scale of the shift is already visible in the numbers. The World Economic Forum's Global Risks Report 2025 named extreme weather the most likely and most impactful global risk of the coming decade, and Howden and Boston Consulting Group estimate that the global climate insurance protection gap could exceed US$1 trillion annually by 2050. Closing that gap is not a matter of taking on more risk blindly. It is a matter of seeing the risk clearly enough to price it properly.
Historical loss data is becoming less predictive
Traditional actuarial models are built on historical loss data. For decades, that approach worked reasonably well, because the past was a fair guide to the future. Under a changing climate, that assumption no longer holds. Catastrophe models adjusted annually still look backwards by design, which means they systematically underweight risks that are intensifying faster than the historical record shows.
The consequence cuts both ways. Insurers relying on outdated views may underprice risk in regions where exposure is quietly climbing, eroding solvency over time. Others may overcorrect, withdrawing from entire markets or postcodes based on broad, conservative assumptions, and in doing so, decline business that a more precise model would show to be entirely manageable. Both outcomes shrink the market. Both widen the protection gap.
What granular risk profiling actually requires
Underwriting with confidence in this environment calls for three things that legacy tools were not designed to provide.
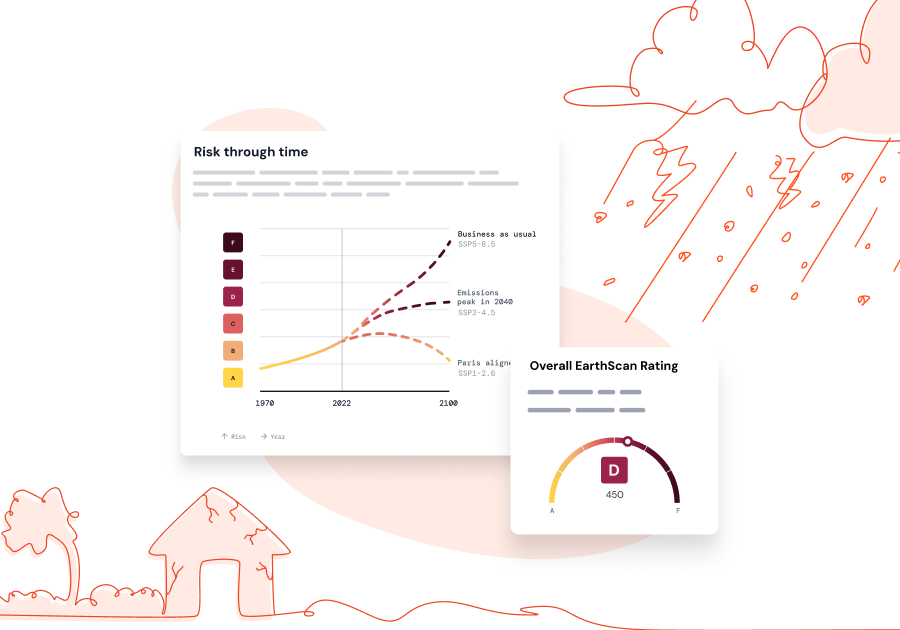
The first is forward-looking modelling. Rather than assuming tomorrow will resemble yesterday, physics-based climate models simulate how floods, wildfires, windstorms and heat behave under a range of future scenarios, over the timeframes that actually matter for underwriting and portfolio planning.
The second is resolution at the level of the individual asset, not the postcode or region. A single flood zone can contain buildings with very different exposure, depending on elevation, drainage and construction. Averaging across a wide area hides exactly the detail that determines whether a specific risk is worth taking on.
The third is return periods, the language insurers already use to talk about the frequency of extreme events. Translating hazard intensity into standard return periods, rather than a generic hazard score, means the output slots directly into pricing and reserving conversations that are already underway.
This is precisely where EarthScan risk intelligence is built to sit. It combines physics-based climate modelling with asset-level spatial resolution and standard return periods, so that underwriting and portfolio teams are working from a forward-looking view rather than a historical one. And because the same standardised data can be shared downstream, policyholders themselves gain a basis for using climate risk data for security and resilience planning, which gives insurers a shared, defensible starting point for the conversation about risk, rather than two sides working from different assumptions.
A hotel group, a global broker, and a more precise conversation
A recent example illustrates what this looks like in practice. A leading international hospitality group, with more than 120 properties and over 30,000 employees across some of the world's most climate-exposed coastlines, had already recorded losses exceeding €500,000 from individual weather events. The stakes for this kind of exposure are not abstract: the International Monetary Fund has found that a ten percentage-point increase in a destination's climate vulnerability can translate into a nine percentage-point decline in tourism earnings per visitor. Premiums were rising, and general awareness of climate exposure was no longer enough. What the group needed was asset-level precision: which properties were most exposed, to which specific hazards, and what that meant in financial terms.
Working alongside one of the world's largest insurance brokers, the group used this granular exposure data to inform its resilience strategy, including targeted investment in nature-based infrastructure, such as coral reef and mangrove restoration, to reduce storm surge risk at its most exposed sites. The value of this kind of measure is well documented: healthy coral reefs alone can reduce wave energy by up to 97%, and the World Resources Institute estimates that every US$1 invested in climate adaptation generates more than US$10 in benefits over a ten-year period. Armed with a documented, asset-level view of both the risk and the mitigation measures in place, the broker was able to secure more favourable insurance terms for the group's programme.
The result is a straightforward one. When exposure is quantified rather than assumed, insurers can recognise genuine resilience investment in the price they offer, rather than falling back on regional averages. That is what allows the industry to keep doing its job, protecting customers, even as physical risk continues to rise.
Underwriting for the climate that is actually coming
None of this replaces the expertise underwriters and actuaries already bring to the table. It gives that expertise a clearer, forward-looking foundation to work from, asset by asset, scenario by scenario. For an industry built on pricing uncertainty, that is a meaningful advantage.
Interested in how EarthScan risk intelligence could support your underwriting or portfolio strategy? Get in touch with our team.