Hail is no longer just a seasonal nuisance. It’s a growing climate hazard that’s already causing billions in damages across agriculture, energy, and infrastructure.
As climate change intensifies hailstorms, making them larger, more frequent, and more destructive, businesses and consultancies must rethink how they assess and manage this risk.
Mitiga Solutions’ new hail hazard capability helps organisations understand hail exposure as part of their physical climate risk. In this post, we explore what hail is, why it matters, and how data-driven insights can support better asset protection and climate disclosure alignment.
As hail becomes more severe and widespread, the need for accurate, forward-looking data is urgent. Businesses and consultancies must move beyond reactive loss coverage and begin to integrate hail hazard into their planning, investment, and disclosure strategies.
What is hail, and why is it a growing climate hazard?
Hail is a form of solid precipitation made up of ice pellets that develop within deep convective clouds, typically during intense thunderstorms. When powerful updrafts carry supercooled water droplets high into the atmosphere, they freeze and grow through the accretion of successive ice layers before falling to the ground as hailstones.
These can range in size from a few millimetres to several centimetres and often strike with enough force to crack solar panels, dent vehicles, destroy crops, and damage eolic turbines and critical infrastructure.
Although hail is a highly localised weather event, it is one of the most damaging climate hazards globally. Its impacts are widespread, affecting agriculture, energy, and construction sectors.
Hail hazard snapshot: United States and Europe
Hail activity in the United States (2024)
- Frequency of events: The U.S. experienced 5,373 hail events in 2024.
- Most affected states:
- Texas: 878 events
- Kansas: 495
- Missouri: 437
- Nebraska: 372
- Oklahoma: 339
- Insurance impact: In 2022, State Farm paid out over $3.5 billion in hail claims, a $1 billion increase from the previous year. This rise was driven by both increased hail activity and inflation-related repair costs.
Hail activity in Europe (2024)
Although 2024 did not see hailstorms as intense as some recorded in 2023, it was still a notably active year for hail across Europe. According to the European Severe Storms Laboratory (ESSL), 10,092 hail reports were submitted in 2024, the highest annual total on record.
The year also saw 243 days with large hail (≥ 2 cm) and 101 days with very large hail (≥ 5 cm). However, the number of the most damaging events declined compared to 2023: very large hail reports dropped from 1,946 to 1,086, and giant hail (≥ 10 cm) reports fell from 97 to 19.
Hail activity varied across the continent. In June, southeastern Europe experienced multiple long-tracked and destructive hailstorms, making it the most active month for large hail. By mid-July, the frequency of severe hailstorms declined, coinciding with widespread drought conditions across much of Europe.

Climate change is increasing hail severity and exposure risk
Historically, hailstorms have been considered sporadic and notoriously difficult to model, and they remain so today. Despite advances in numerical weather prediction (NWP), forecasting hail continues to pose significant challenges.
This is largely due to the complexity of convective dynamics, the microphysical processes involved in hail formation, and the need for high-resolution modelling to capture these phenomena accurately.
As noted by Wellmann et al. (2018, 2020), explicit hail prediction requires models to simulate a wide range of interacting processes, including turbulence and thermodynamic conditions within deep convective clouds.
Similarly, Raupach et al. (2021) highlight that limited direct observations and computational constraints further hinder our ability to model hail effectively.
While global trends in hail frequency remain uncertain, emerging research suggests that climate change may be influencing hailstorm behaviour, particularly by increasing hail severity. Warmer surface temperatures and greater atmospheric instability are contributing to the formation of larger and more damaging hailstones.
Regions previously considered low-risk are now experiencing severe hailstorms, with rising hail intensity and associated losses. As hail becomes more severe and exposure risks expand, the need for accurate, forward-looking data is urgent, especially for organisations seeking to protect assets and meet evolving climate disclosure requirements.
How hail affects society and business
Hail is not just a meteorological event, it’s a multi-sector climate hazard with tangible consequences for businesses, communities, and economies.
As hailstorms grow in intensity and frequency, their impacts are being felt across critical industries and infrastructure.
Consequences of hail hazard
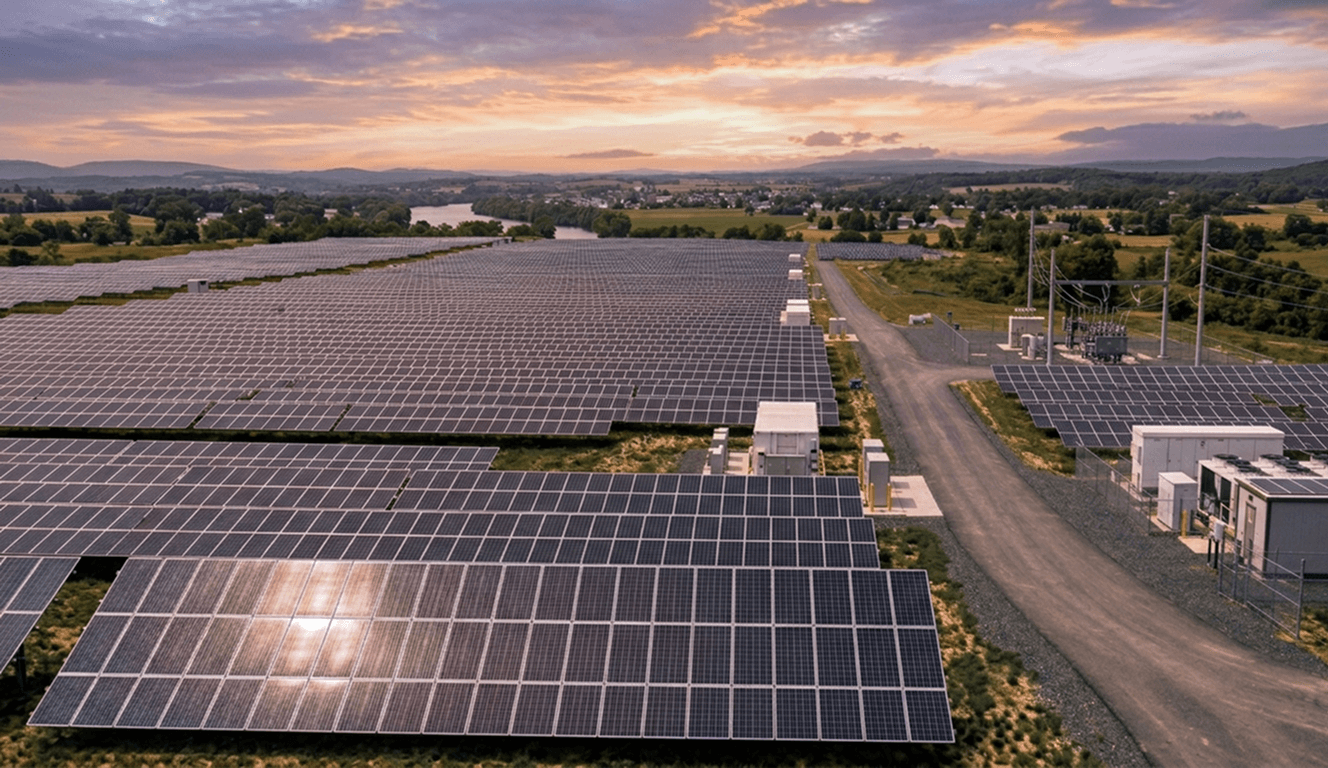
- Renewable energy: Solar panels are particularly vulnerable to hail impact. Even small hailstones can cause micro-cracks that reduce efficiency, while larger ones can shatter glass surfaces entirely. Transmission lines, wind turbines, and substations are also at risk, especially in exposed rural areas.
- Infrastructure and construction: Buildings, roads, and telecom towers face structural damage from hail, including broken windows, cracked facades, and compromised roofing materials. This leads to costly repairs and service interruptions.
- Insurance and finance: Hail drives up claims across property, automotive, and agricultural lines. Insurers face challenges in pricing risk accurately, validating claims, and managing exposure. Financial institutions with asset portfolios in hail-prone regions are increasingly exposed to climate-related volatility.
- Agriculture: Hail can shred leaves, bruise fruits, and destroy entire crop yields in minutes. From vineyards in Italy to grain fields in France, hailstorms are responsible for significant agricultural losses, threatening food security and farmer livelihoods.
- Food supply chains: Beyond direct crop damage, hail disrupts logistics and cold chain operations, especially for fresh produce. Greenhouses and storage facilities are also vulnerable, compounding losses across the value chain.
Social costs
Hail damage can lead to food insecurity, energy disruption, and housing vulnerability, particularly in regions with limited resilience infrastructure. For communities dependent on agriculture or solar energy, hailstorms can be economically devastating.
Verticals most affected by hail hazard
Hail affects multiple sectors in distinct ways. Here’s a snapshot of the most exposed industries and the types of impacts they face:
Hail is no longer a rare or localised threat. It’s a strategic climate risk that demands proactive planning, accurate data, and cross-sector collaboration.
In the next section, we’ll explore how Mitiga Solutions’ new feature, hail hazard, empowers organisations to understand, quantify, and act on hail risk.
How Mitiga Solutions’ technology helps businesses understand the impact
Understanding hail hazard requires more than historical anecdotes or reactive insurance claims. It demands science-based intelligence that spans decades, adapts to future climate scenarios, and integrates seamlessly into business workflows.
That’s exactly what Mitiga Solutions’ hail hazard capability provides: science-based data designed for decision-making.
What makes Mitiga Solutions’ hail intelligence different?
Mitiga Solutions’ hail hazard is built on a unique combination of physics-based modelling, AI, and supercomputing, designed to provide high-resolution, forward-looking insights into hail risk across Europe and the United States.
Here’s what sets it apart:
Historical and future climate risk data
Access hail event reconstructions from the 1970s through to 2100, delivered in 5-year increments. This enables validation of past losses, climatology trend analysis, and future risk modelling under multiple IPCC scenarios (SSP1-2.6, SSP2-4.5, SSP5-8.5).
High-resolution outputs
Data is delivered at 25 km resolution, offering continental coverage for Europe and the U.S. This granularity supports asset-level risk assessments and regional planning.
Multi-variable insights
Includes metrics such as the annual number of hail days and whether the trend is increasing or decreasing, critical for understanding exposure and planning mitigation.
Validated AI models
Mitiga uses transfer learning and high-performance computing (HPC) via MareNostrum 5 to ensure accuracy, even in data-scarce regions. This approach enhances predictive power and reliability.
API-first delivery
The feature is available exclusively via API, allowing consultancies, corporates, and insurers to integrate hail hazard data directly into their platforms, models, and decision-making workflows.
Why it matters
Most organisations lack the internal capacity to model hail risk, especially under future climate conditions. Mitiga’s hail hazard fills this gap by offering:
- Visibility from past to future: Businesses can move beyond reactive coverage and start planning for resilience, using data that spans five decades and projects risk up to 2100.
- Confidence in long-term decisions: Science-based, regulator-aligned data supports capital allocation, asset siting, and insurance pricing with greater certainty.
- Support for climate disclosures: Hail hazard data can inform reporting aligned with standards such as IFRS S2, helping companies meet ESG and regulatory requirements by assessing physical climate risks more accurately.

What you can do with hail intelligence?
Mitiga’s hail risk data is designed to support real decisions across sectors. With forward-looking projections and 25km high-resolution coverage, businesses can use this intelligence to strengthen planning, pricing, and advisory services.
- Corporates and Investors
Use hail projections to inform asset siting, capital allocation, and long-term resilience strategies. The data helps identify exposure hotspots and supports decisions that reduce operational and financial risk.
- Insurers
Improve pricing accuracy, validate historical claims, and develop parametric products. Mitiga’s hail intelligence provides a scientific basis for underwriting and product innovation, especially in regions where hail risk is rising.
- Consultancies
Add value to climate risk assessments and disclosures with hail data that few others can offer. Our technology supports advisory work with robust, forward-looking insights that help clients understand and manage hail exposure.
The data is delivered via API, making it easy to integrate into existing platforms and workflows. Whether you're building internal dashboards or client-facing tools, Mitiga’s hail intelligence is built for seamless adoption.
Hail risk is rising and your business need to be ready
Hail is becoming more severe in many regions, yet it remains one of the least underestimated climate hazards. Businesses that rely on historical averages or generic models are likely underestimating their exposure.
Mitiga’s hail hazard technology provides a clearer view. With data from 1970 to 2100 under IPCC scenarios, and coverage across the US and EU at 25 km resolution, our platform helps organisations understand how hail risk is changing and what they can do about it.
By integrating hail intelligence into planning, pricing, and advisory work, companies can move from reactive to proactive risk management. This is not just about protecting assets. It’s about building resilience, improving transparency, and making decisions that are grounded in climate science.
To learn more, book a demo and explore how our solution supports climate-aware decision-making.