Most climate risk platforms come with a user interface. But what if your team wants to plug climate intelligence directly into your tools, dashboards, or workflows?
That’s where EarthScan API comes in.
Designed for scale, speed, and precision, EarthScan API gives you direct access to asset-level climate risk data without needing to click through dashboards or wrangle spreadsheets.
Whether you're screening infrastructure projects, building risk models, or preparing climate disclosures across thousands of assets, the API brings climate intelligence into your stack, on your terms.
We’ll walk through:
- What the API does and who it’s for
- Key technical capabilities and customisation options
- How it compares to the EarthScan platform
- Examples of how it’s used
- When an API makes more sense than a SaaS UI
If you’re building climate risk into your workflows or working with large portfolios that need automation and scale, this article is for you.
What is EarthScan API?
EarthScan API gives you direct access to Mitiga Solutions' climate risk intelligence without the user interface.
It’s the same underlying science and modelling that powers the EarthScan platform, delivered in a format that fits additional technical workflows.
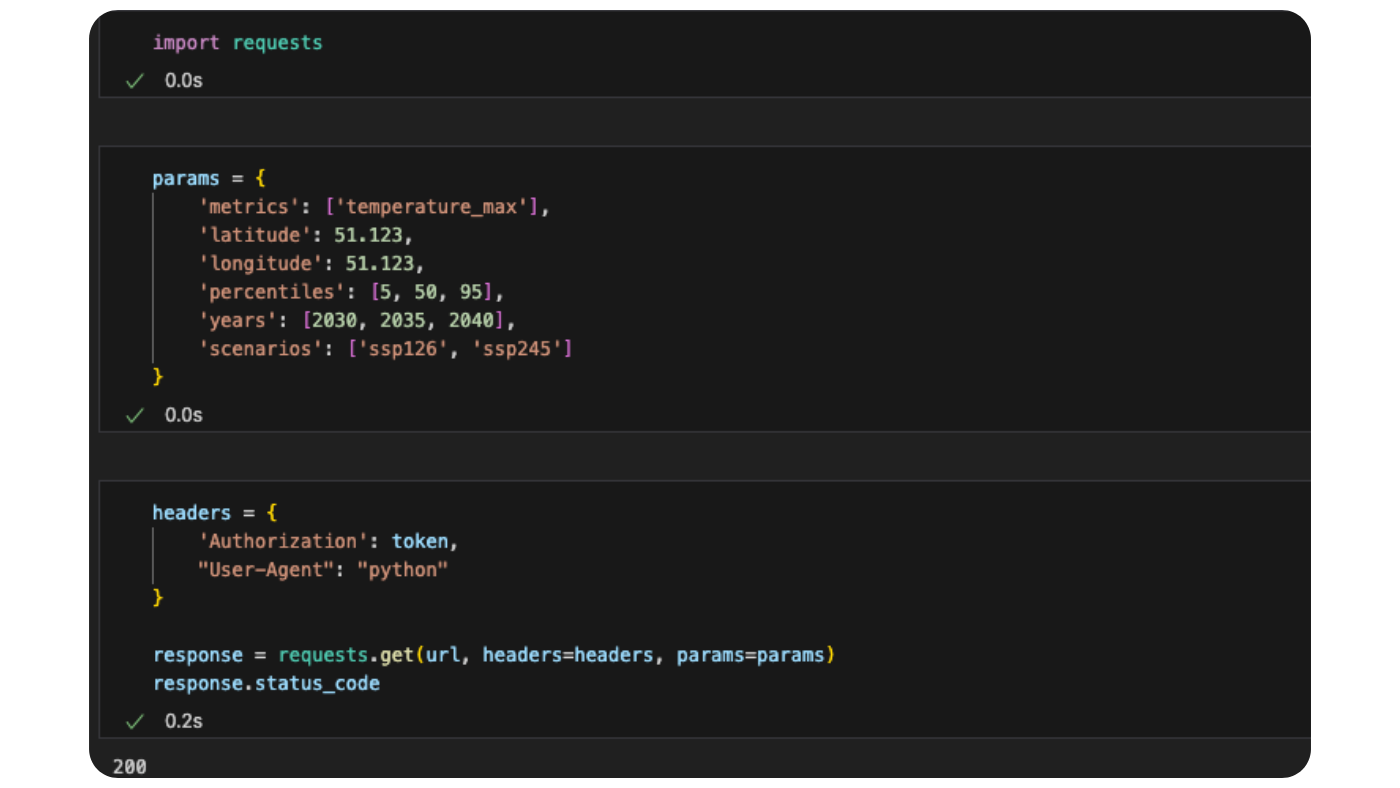
It connects directly to Mitiga’s ratings and metrics API’s, allowing users to pull both quantitative data (like temperature, precipitation, wind gusts) and qualitative ratings (like hazard grades) across multiple scenarios and timeframes.
The API offers endpoints for both metrics (1970–2100, in 5-year steps) and ratings, with flexible parameters such as climate scenarios, return periods, percentiles, and geographic coordinates.
Instead of logging into a dashboard, you call the API to request exactly the data you need: specific hazards, time periods, climate scenarios, return periods, and locations. That means:
- No browser limitations
- No manual downloads
- No bundled outputs you don’t need
You define the scope. The API returns clean, structured data ready to plug into your own tools, models, or dashboards.
For example, a real estate fund could retrieve coastal flood data for an asset in southern Spain, filtered to a 100-year return period under a business-as-usual scenario. All via a single API call.
While each request is limited to one coordinate and one metric at a time, the API is built for automation. It can be integrated with ETL pipelines, scripts, or internal tools to scale queries across thousands of assets and hazard types with ease. No manual interface needed.
Who is this climate risk API for?
EarthScan API is built for organisations that want to integrate climate risk data directly into their own data systems or platforms.
That includes:
- Insurers enriching underwriting models or pricing exposure at scale
- ESG and climate consultancies delivering risk insights through custom dashboards or client platforms
- Energy and renewable infrastructure firms feeding hazard data into project planning, site selection, or asset performance models
- Real estate investors and operators embedding location-level risk data into acquisition or maintenance workflows
- Financial institutions mapping climate exposure across portfolios for regulatory or credit risk analysis
If your team already works with internal data tools or you’re building your own ESG or climate platform, the API lets you pull in high-resolution hazard data without switching tools or relying on third-party interfaces.
Rather than a one-size-fits-all dashboard, the API provides a flexible backend that fits into your environment and scales with your needs.

Why choose an API over a platform?
Most climate risk tools are built around a platform, a user interface where you upload assets, click through maps, and download reports.
That works for many teams and use cases. But for organisations with internal systems and technical workflows, a UI can get in the way. And in many cases, an API is the more scalable choice.
Here’s when and why EarthScan API might be a better fit:
- Skip the interface. No need to upload assets manually or work around browser limitations. Just query the data you need, when you need it.
- Scale with automation. While each API call currently supports one asset and one signal at a time, the API is designed to integrate with scripts and data pipelines allowing teams to automate requests and scale data extraction across thousands of assets.
- Integrate into your workflows. Feed climate risk data directly into existing dashboards, GIS tools, underwriting engines, or reporting templates.
- Stay in control. Choose specific hazards, time ranges, return periods, and climate scenarios instead of receiving a full asset dataset every time.
With EarthScan API, you request exactly the data you need by hazard, scenario, return period, or geography and receive it in a format ready for your systems.
Key benefits and differentiators
For many organisations, the EarthScan platform offers everything they need: an intuitive interface, dashboards, instant reports, and pre-mapped global assets.
But when you need to integrate climate risk data directly into your own systems or data workflows, the API offers a different path, one built for scale, speed, and flexibility.
1. Same science, different delivery
The EarthScan API runs on Mitiga’s Multiple Futures Model, a validated forecasting engine built to model climate extremes and uncertainty.
It combines:
- Climate datasets like CMIP6, CORDEX, ERA5, NASA GDDP, and Copernicus GLO-30/GLO-90
- Bayesian methods and Gaussian Process Regression
- Validation against observed data from 1980–2020
You get the same science-backed outputs as the EarthScan platform, delivered programmatically into your systems.
2. Granular control over queries
Request only the hazards, return periods, timeframes, and scenarios you need. Nothing extra.
3. Flexible, usage-based pricing
Costs scale with volume. The more you request, the lower the cost per call. Ideal for high-frequency or high-volume users.
4. Custom Climate Value at Risk (Custom CVaR)
Estimate asset-specific financial impact estimates for wind and flooding, using four asset attributes (e.g. number of floors, basement, occupancy, material type).
5. Access rich, scientifically grounded metrics
Query temperature extremes, precipitation, drought days, fire risk, flood heights and more. All based on physical modelling across 3 scenarios (SSP126–SSP245-SSP585), with optional return periods and percentiles.
6. Qualitative risk ratings at a glance
Retrieve EarthScan hazard scores (A–F), CVaR, exceedance probabilities, and aggregated risk scores. Ideal for fast assessments and reporting pipelines.
7. Built for automation, not manual limits
While each API call retrieves data for a single asset and signal, the API is designed for integration into automated workflows, enabling you to scale climate data extraction across thousands of assets without relying on browser uploads or manual processes.
8. Fast onboarding, tech-friendly outputs
Delivered as structured data (CSV, JSON), with full developer documentation and support. Includes sandbox access for testing and production accounts for deployment.

What kind of climate risk data can you query?
The API gives you access to 3 main data types:
1. Metrics (Quantitative climate data)
Examples include:
- Max temperature (°C)
- Max rainfall over 5 days (mm)
- Consecutive dry days (<1mm/day)
- Flood depth (cm)
- Composite fire risk indicator
You can query these by latitude/longitude, scenario, time period, percentile (e.g. 5th, 50th, 95th), and return period.
2. Ratings (Risk scores and financial indicators)
- A–F grade per hazard (e.g. wildfire, drought, heat stress)
3. Other indicators
- CVaR: Percentage of direct damage depending on the intensity of a flood or wind event.
- Exceedance probability: Likelihood of a hazard exceeding a given threshold
- Exceedance Probabilities with Upper Custom Thresholds: Same, but using your own threshold value
Together, these let you measure both intensity and likelihood of future hazards from 1970 to 2100 across multiple global warming scenarios.
How EarthScan API supports scale
When you're managing thousands of assets or building tools for multiple clients, scalability isn’t a nice-to-have, it’s a necessity.
EarthScan API is built for high-volume use cases, helping teams move beyond the limitations of browser-based platforms:
- Designed for automation. Each API call retrieves data for one location and signal, but the API is built for integration into scripts, ETLs, or pipelines, allowing users to scale seamlessly across thousands of assets with minimal manual input.
- Fits into your stack. Plug EarthScan data directly into your internal systems or client-facing tools via backend integration. No need for user interfaces or manual downloads. No delays, just direct access to climate risk intelligence.
- Reduces manual effort. By automating requests and outputs, the API removes the need for file uploads, filtering, or repetitive exports, improving speed and reducing the risk of error.
- Supports regulatory workflows. Preparing CSRD or IFRS S2 disclosures at scale? The API allows you to query hazard exposure, scenarios, and return periods programmatically, helping consultants and ESG teams build automated, auditable reporting pipelines.
This is especially relevant for large and boutique consultancies developing multi-client tools, insurance teams evaluating national portfolios, or financial institutions preparing for Waves 2 and 3 of climate disclosure regulations.
You can choose between two account types:
- Sandbox (free, single-location testing environment)
- Production (unlimited querying with flexible billing per contract)
This makes the API useful not just for large-scale implementations, but also for piloting internal tools or embedding into prototypes.
If you'd like to see the API in action, check out our success story: How Sustain 2050 scales climate risk analysis across thousands of assets.
When to choose EarthScan API vs. EarthScan platform
EarthScan offers two ways to access climate risk data, the self-serve SaaS platform and the API. Which one you choose depends on how your team works and what you need the data for.
Choose the EarthScan platform if you need:
- A user interface for exploring asset-level insights and portfolio trends
- Instant visuals, filters, and team-wide access
- Pre-built Excel or PDF reports for disclosure or decision-making
- A fast way to get started without development work
Choose EarthScan API if you need:
- Direct data access inside your own tools, models, or dashboards
- Integration with internal workflows or client-facing applications
- The ability to scale to thousands of assets per request
- More flexibility in how you query hazards, return periods, and scenarios
In short:
👉 Use the platform if you want a ready-to-go workspace for exploring risk and generating reports.
👉 Use the API if you need to integrate climate risk data into existing systems, data products, or enterprise workflows, or if you’re building your own tools on top of it.
Using both the EarthScan platform and API is also an option. Many clients find value in combining the UI for quick insights with the API for deeper integrations or automation.
Comparison table: EarthScan platform vs EarthScan API
Bringing climate risk data to where your work happens
Whether you’re integrating climate risk into underwriting models, powering internal dashboards, or supporting large-scale reporting workflows, EarthScan API gives you flexibility and scale without the overhead of a user interface.
You get direct access to the same science-backed data that powers EarthScan, tailored to your portfolio, use case, and technical environment.
If you’re exploring how to bring climate data into your systems, we’re happy to help. Talk to our team about integrating EarthScan API into your existing workflows.